实战: 分析Elasticsearch 查询语句
目标
- 收集ELasticsearch集群的查询语句
- 分析查询语句的常用语句,响应时长等
方案
- 应用Packetbeat + Logstash完成数据收集工作
- 使用Kibana + Elasticsearch完成数据分析工作
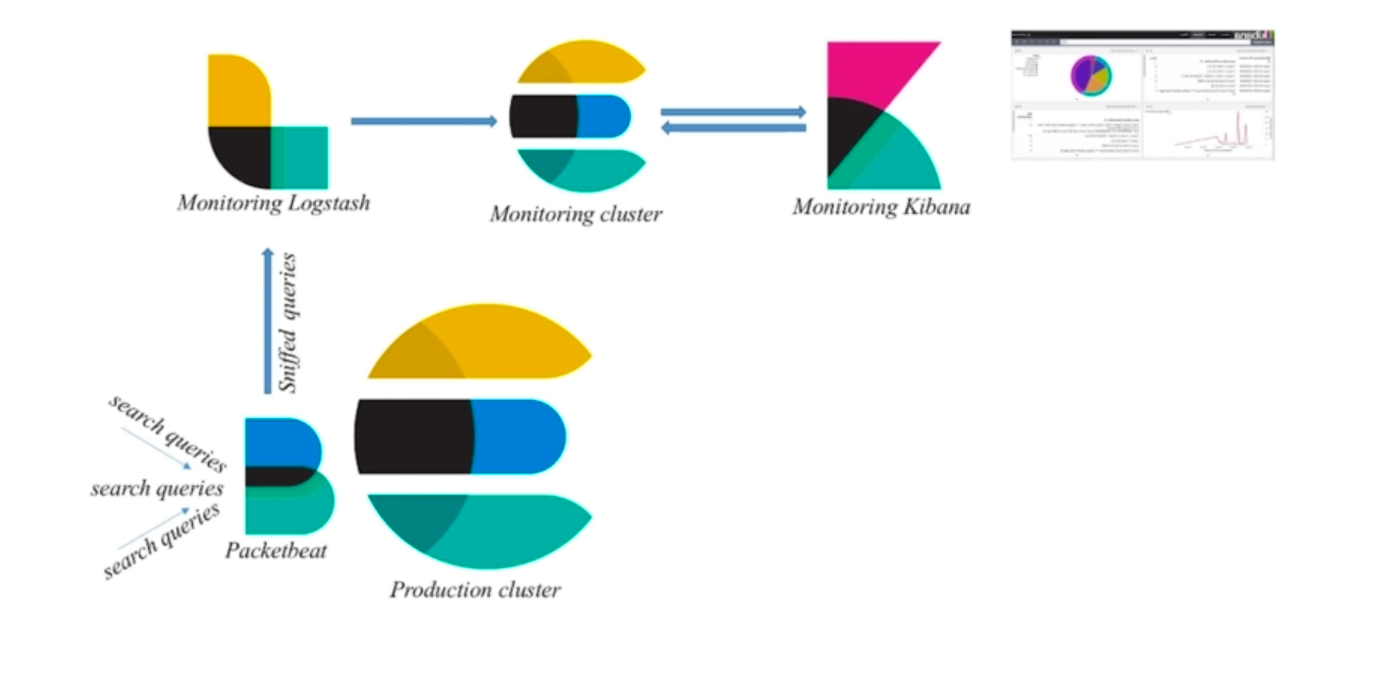
Production Cluster # 生产数据
- Elasticsearch http://127.0.0.1:9200
- Kibana http://127.0.0.1:5601
Monitoring Cluster # 存储Packetbeat抓取到的Production Cluster产生的数据
Elasticsearch http://127.0.0.1:8200
bin/elasticsearch -Ecluster.name=sniff_search -Ehttp.port=8200 -Epath.data=sniff
Kibana http://127.0.0.1:8601
bin/kibana -e http://127.0.0.1:8200 -p 8601
Production 和 Monitoring 不能是一个集群,否则会进入抓包死循环
方案配置信息
方案之Logstash配置
配置文件(sniff_search.conf)
input {
    beats {
        port => 5044
    }
}
filter {
    if "search" in [request]{
        grok {
            match => { "request" => ".*\n\{(?<query_body>.*)"}
        }
        grok {
            match => { "path" => "\/(?<index>.*)\/_search"}
        }
     if [index] {
      } else {
            mutate {
              add_field  => { "index" => "All" }
        }
      }

      mutate {
              update  => { "query_body" => "{%{query_body}"}}
      }

  #    mutate {
  #        remove_field => [ "[http][response][body]" ]
  #    }
}

output {
  #stdout{codec=>rubydebug}

      if "search" in [request]{
        elasticsearch {
        hosts => "127.0.0.1:8200"
        }
   }
}
方案之Packetbeat配置
配置文件(packetbeat_es.yml)
packetbeat.interfaces.device: lo

packetbeat.protocols:
- type: http
  ports: [9200]
  send_request: true
  include_body_for: ["application/json","x-www-form-urlencoded"]

output.logstash:
  hosts: ["127.0.0.1:5044"]
实战步骤
1.运行Production Cluster
运行Elasticsearch (–Production , port=9200, cluster.name=prod_cluster, path.data=prod_data)
[jlc@localhost elasticsearch-6.1.1]$ bin/elasticsearch -Ecluster.name=prod_cluster -Ehttp.port=9200 -Epath.data=prod_data运行Kibana (–Production , es服务地址 http://127.0.0.1:9200, port=5601)
[jlc@localhost kibana-6.1.1-linux-x86_64]$ bin/kibana -e http://127.0.0.1:9200 -p 5601
2.运行Monitoring Cluster
运行Elasticsearch (–Monitoring , port=8200, cluster.name=moni_cluster, path.data=moni_data)
[jlc@localhost elasticsearch-6.1.1]$ bin/elasticsearch -Ecluster.name=monit_cluster -Ehttp.port=8200 -Epath.data=monit_data运行Kibana (–Monitoring, es服务地址 http://127.0.0.1:8200, port=6601)
[jlc@localhost kibana-6.1.1-linux-x86_64]$ bin/kibana -e http://127.0.0.1:8200 -p 6601运行Logstash (–Monitoring)
[jlc@localhost logstash-6.1.1]$ bin/logstash -f sniff_search.conf运行Packetbeat (–Monitoring)
[jlc@localhost packetbeat-6.1.1-linux-x86_64]$ sudo ./packetbeat -e -c packetbeat_es.yml -strict.perms=false
3.Kibana分析
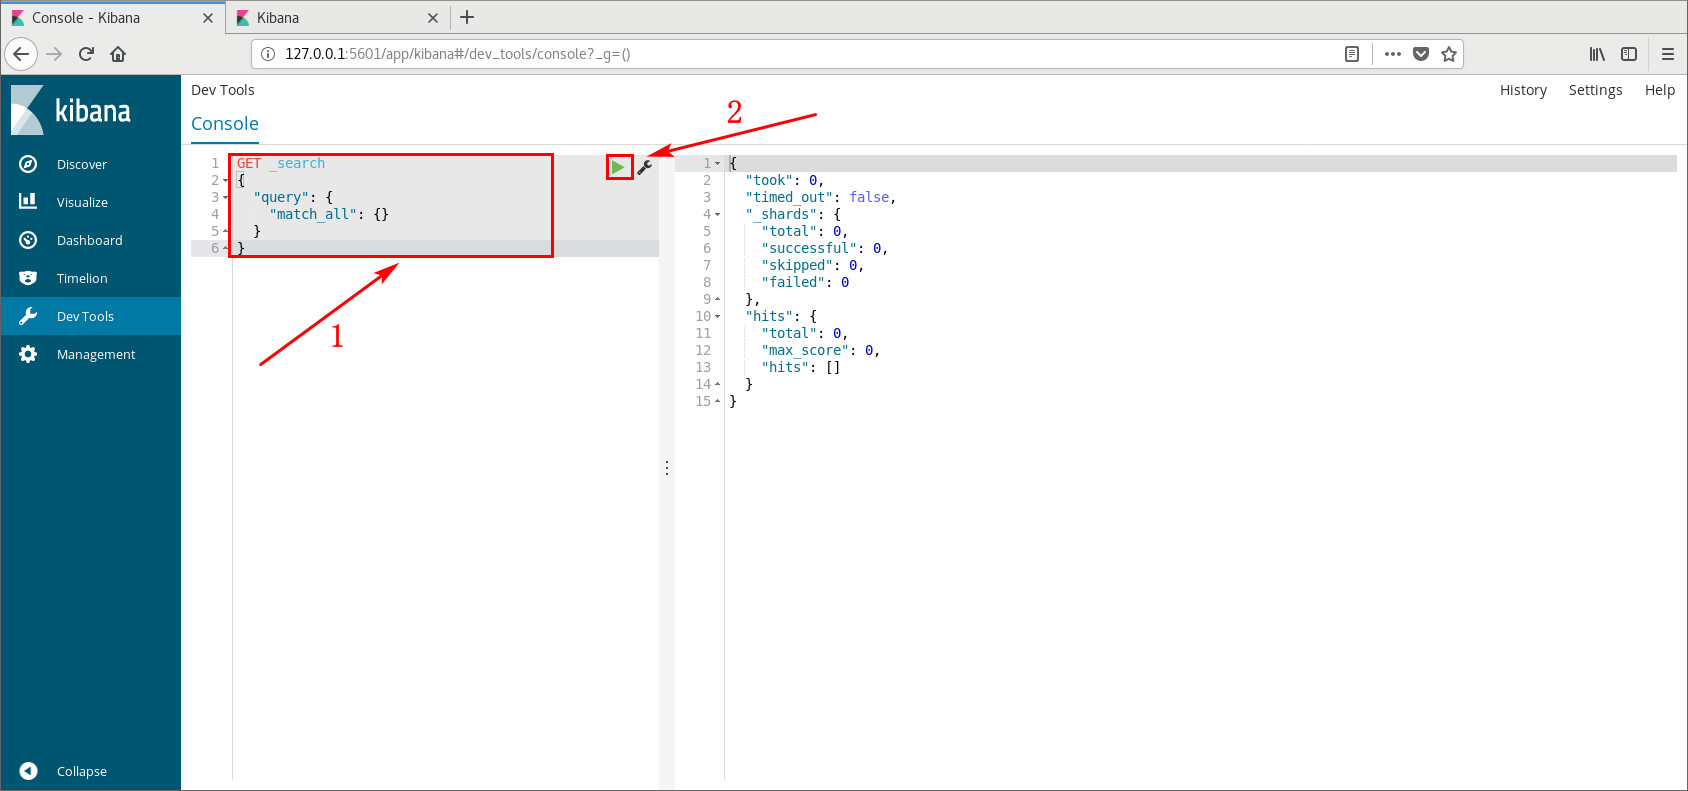
- 1) 在浏览器中打开
http://127.0.0.1:5601/(Production), 点击Dev Tools面板, 进入Kibana控制台界面 - 2) 在Kibana控制台界面输入
Elasticsearch Query语句并运行,如下图所示:
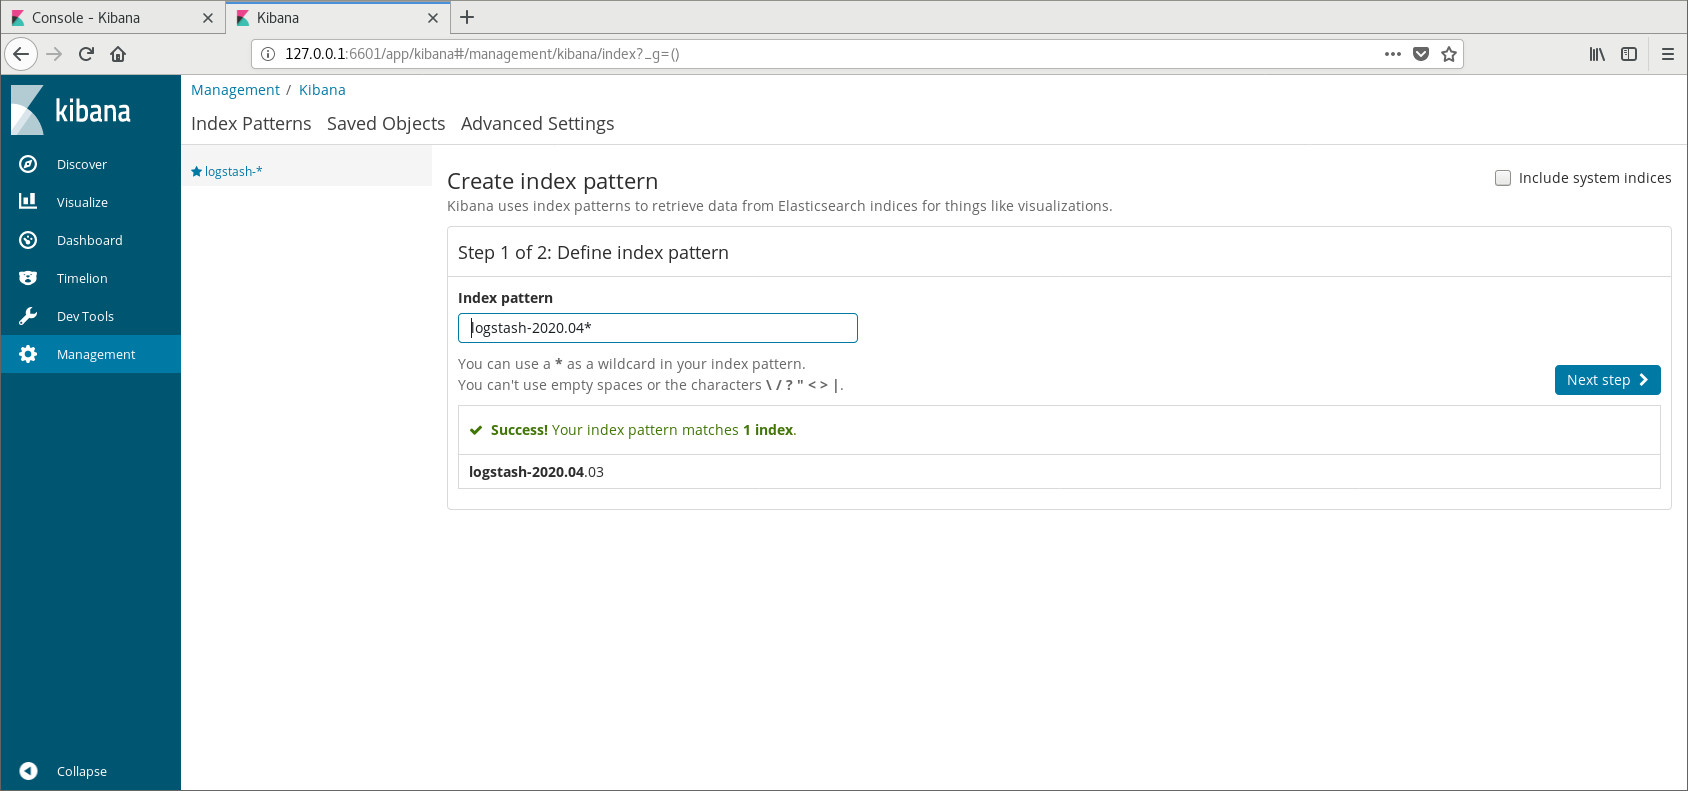
- 3) 在浏览器中打开
http://127.0.0.1:6601/(Monitoring), 点击Management面板, 在Kibana选项选择Index Patterns进行Create index pattern‘; - 4) 在
Index Patterns输入框输入索引的正则表达式(如不明白, 可以输入logstash*进行匹配, 正确匹配后下方会有绿色提示Success),如下图所示.
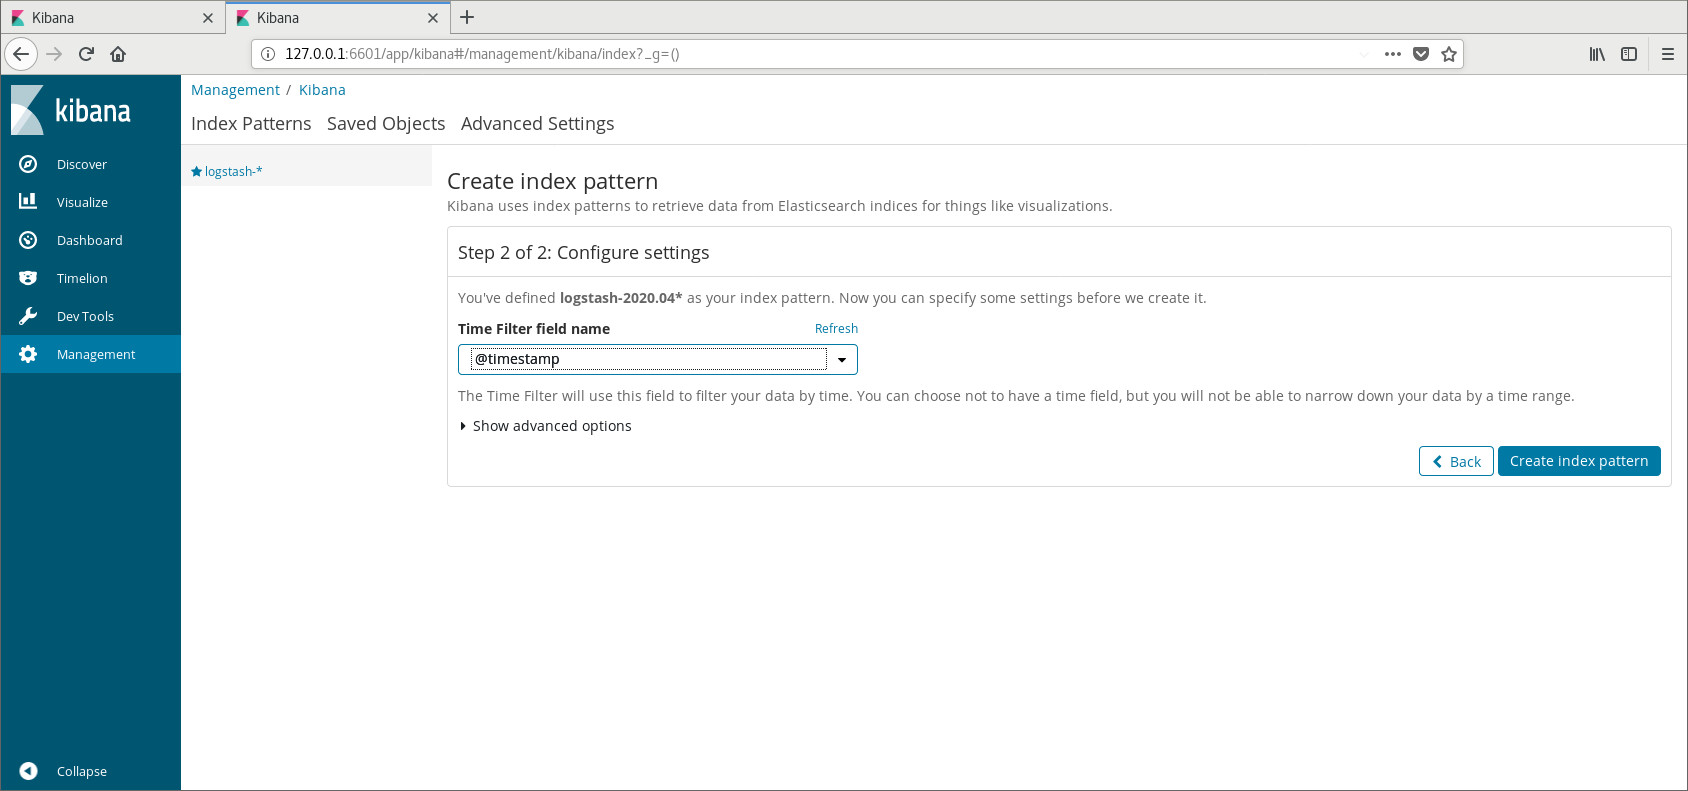
- 5) 点击Next Step进行下一步操作, 在
Time Filter field name下拉框中选择@timestamp,点击Create index pattern;
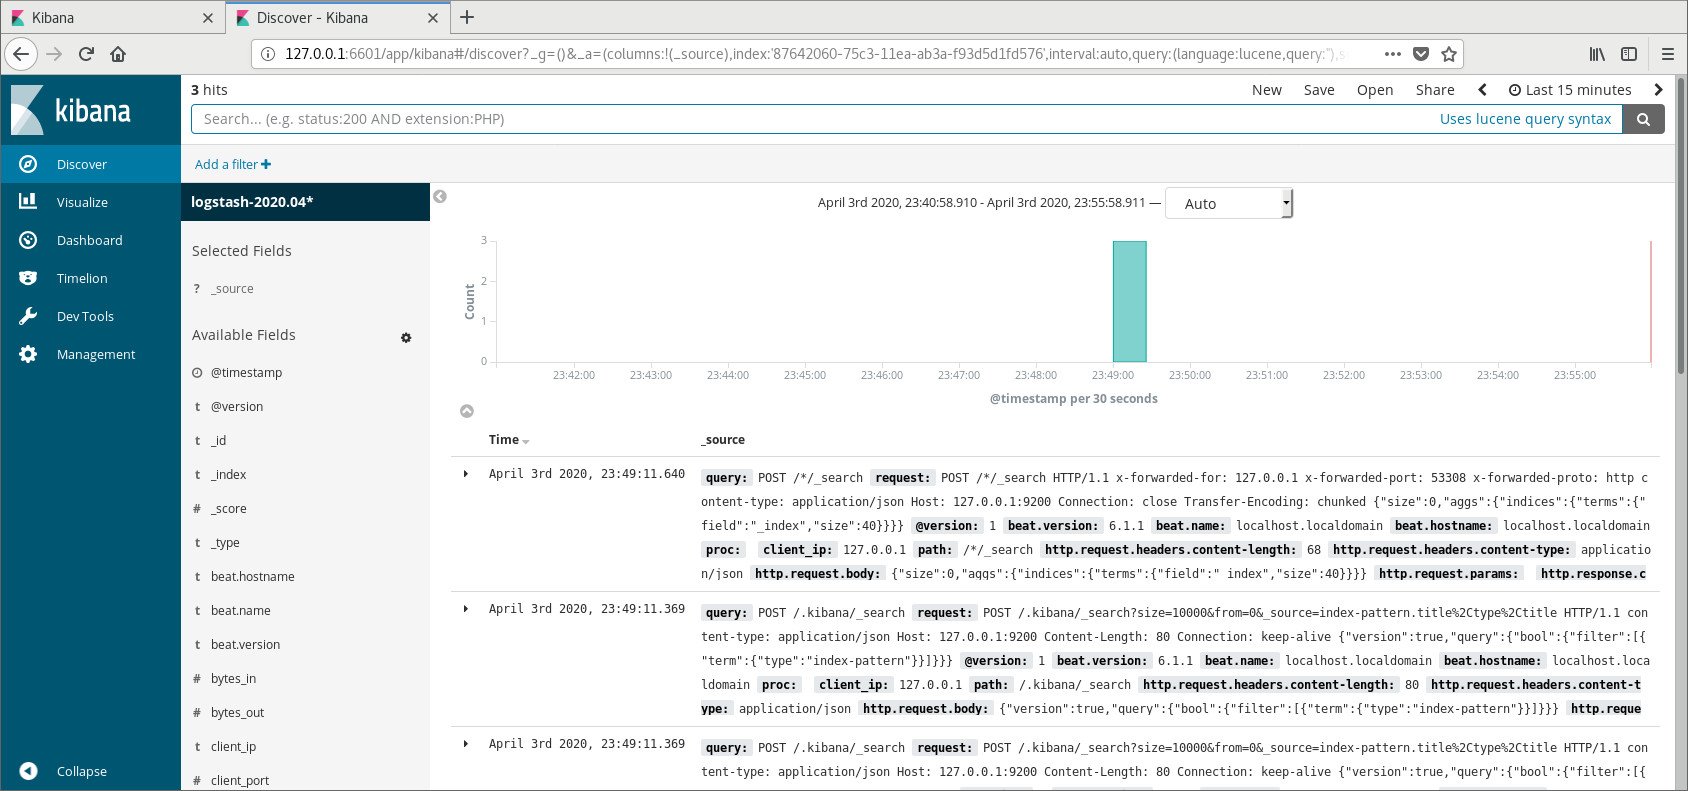
- 6) 点击Discover面板进行查询, 即可显示在
Production中运行kibana的Console面板产生的查询语句,如下图所示:
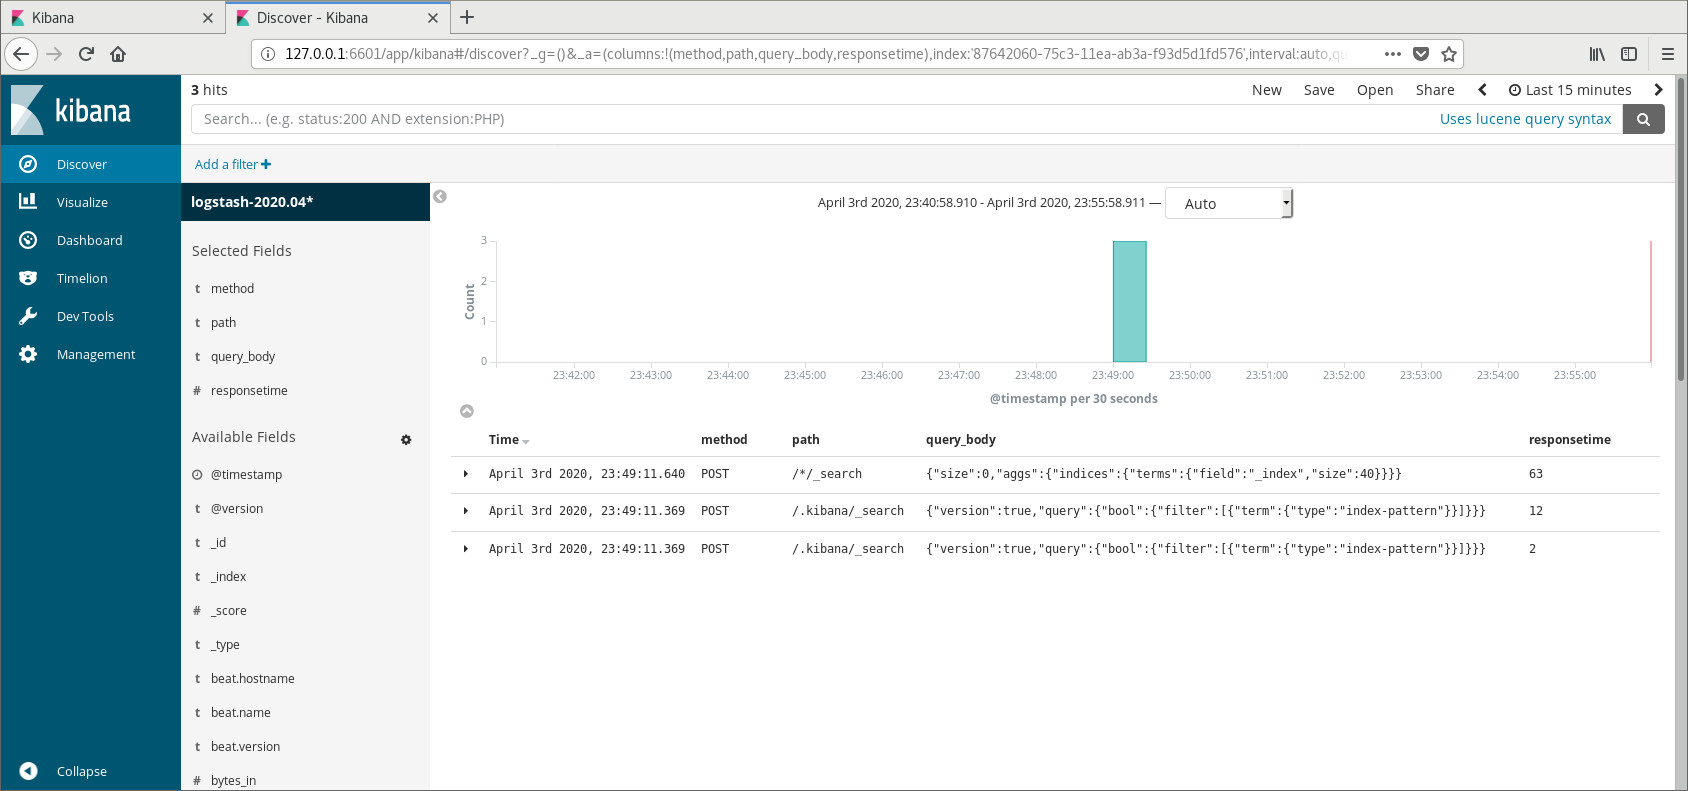
- 7) 选择
Available Fields下方你想要的添加的字段,即可在右方显示对应的日志信息.如:我们选择path,query_body,responsetime字段,界面的显示效果如下所示:
- 8) 制作dashboard: (略)